|
Wooly Worm Conclusion
A. What were the degrees of freedom used in this exercise? The degrees of freedom used in this exercise was six. B. What confidence level should we use when calculating our chi-square value? (use the table below) C. What is the calculated chi-square (χ2) value? 36 D. Do your results indicate that it was chance alone that caused the unequal numbers of capture wooly worm phenotypes? Explain. There was no chance alone that could cause the unequal numbers of capture wooly worm phenotypes. This causes it to be really significant. E. Which colors of worms were subjected to a positive selection pressure? Which colors of worms were subjected to a negative selection pressure? Explain. The green colored worms such as Burt, String Bean, Olive Garden, and Shrek were subjected positive selection pressure because they have traits that are beneficial. The more vibrant colored worms such as Stripey, Eyelash, and Shaggy were subjected to a negative selection pressure because their traits negate or limit reproductive. F. What do these results indicate might happen over time to this wooly worm population? These results indicate that the green colored worm population will grow over time. G. Consider feeding times, feeding habits, ability to see color, vision acuity, and other possible characteristics of predatory birds in nature. How might such characteristics determine selection of certain worm colors? The worms that are easier to see and do not blend into their surroundings will be eaten determining the selection of certain worm colors. H. Consider the school grounds upon which you “fed” on your wooly worms. If this particular environment remained unchanged over a very long period of time, how would the populations change? What would the community look like in ten years? The population would change to the green colors because they are harder to spot in the grass and they blend into their surroundings.
0 Comments
Postlab Questions-- Write out and answer the following questions
1. Identify the parking lot that was the most diverse. Based on your observations during the lab, explain why your prediction in question #1 of the prelab was supported or not supported. The students cars were the most diverse. 2. List the single most abundant species in each set of data, and write a plausible explanation to explain why these are the most abundant species. Chevys were the most abundant species in the student parking lot and Fords were the most abundant species in the staff parking lot. 3. Determine the maximum and minimum values for the Shannon Diversity Index in the parking lot you surveyed. Maximum value for the Shannon Diversity Index is 1.722 in the student parking lot and the minimum value for the Shannon Diversity Index is 1.284 in the staff parking lot. 4. If you conducted this lab in a shopping mall parking lot, predict whether the Shannon Diversity Index would be high or low, and how it would compare to the school parking lots. If I conducted this lab in a shopping mall parking lot, I think the Shannon Diversity Index would be higher than the school parking lots because there are diverse types of cars and a larger number of cars. 5. If you conducted this lab at a new car dealership, predict whether the Shannon Diversity Index would be high or low, and how it would compare to the school parking lots. If I conducted this lab at a new car dealership, I think the Shannon Diversity Index would be low compared to the school parking lots because there is a larger number of the same type of car. 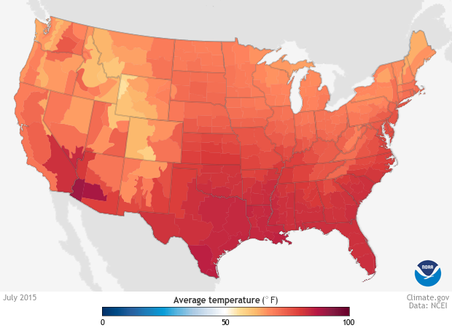 The temperature in July of 2015 was warmer than normal, especially in the south states. 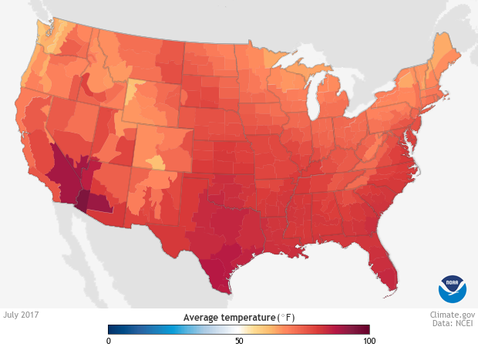 The United States was warmer than usual during July of 2017. South of California and parts of Arizona had around 100 degree temperature. 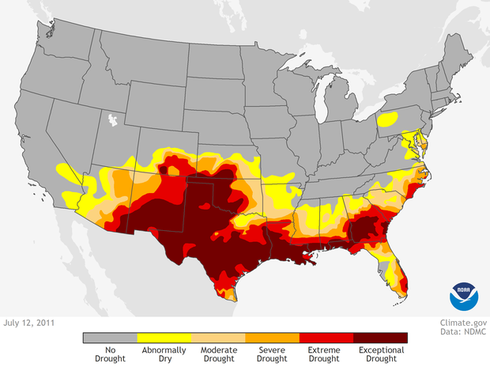 During the month of July of 2011, Texas was in an exceptional drought. 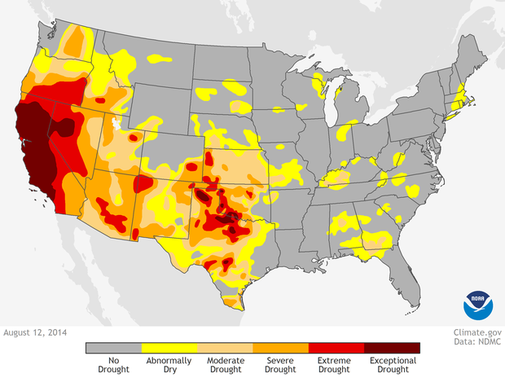 On August 5, 2014 the drought monitor shows that California is in an exceptional drought. The dark red almost covers California but it mainly focuses on the west coast and the valley. Looking at the data of the drought monitor, I noticed that California was experiencing a major drought during the summers of 2014, 2015, and 2016
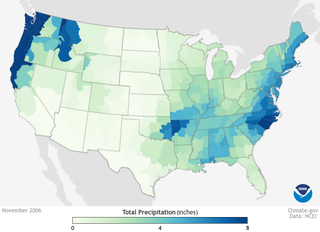
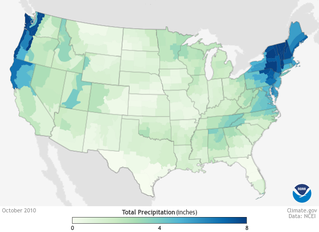
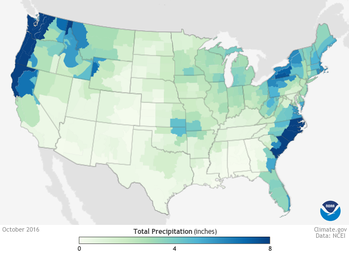 As I looked through the data of the total monthly precipitation of the United States, I noticed that the main rainfall throughout the years in October and November was in Washington and Oregon on the west coast and the states on the east coast.
The population of Turlock is expanding at a stable rate because there are fewer people replacing the older generation.
The population of San Francisco is rapidly decreasing because the younger generation is not replacing the previous generation.
The male population is decreasing at a rapid rate because the younger generation is not replacing the previous. The female population on the other hand is expanding at a stable rate because they are increasing gradually and replacing the previous generation.
The population of Los Angeles, California is slowly declining because the younger generation is not replacing the previous generation.
The population of Seattle, Washington is declining at a faster rate. The younger generation is not replacing the older generation.
The population of San Diego, California is slowly decreasing because the younger generation is not replacing the older generation.
The population of Houston, Texas is decreasing at a slow rate because the younger generation is not replacing the previous generation.
|
AuthorWrite something about yourself. No need to be fancy, just an overview. Archives
October 2017
Categories |
 RSS Feed
